Step 01 · Capture
It all starts with one photo.
No barcodes. No databases to search. No grams to weigh. Open VitaMenda, point your camera at the plate, and the rest happens for you.
- 01
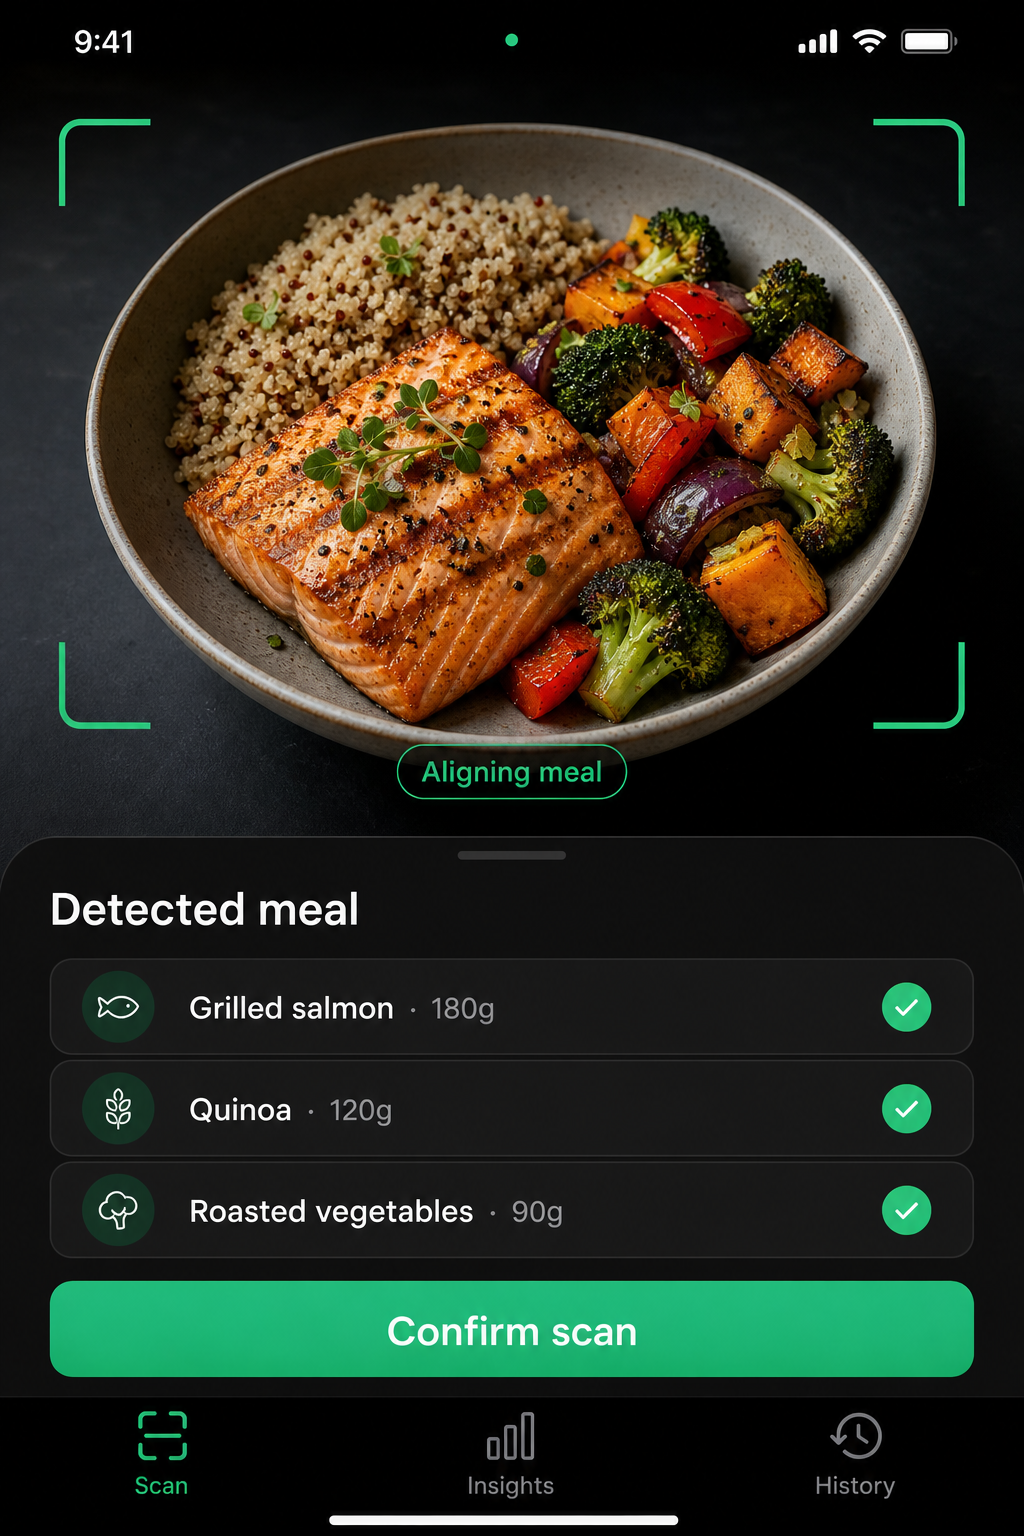
Snap
Take a photo of any meal — restaurant, home-cooked, packaged.
- 02
Parse
AI vision identifies ingredients and portion sizes in seconds.
- 03
Aggregate
Calories, macros, vitamins and minerals roll up across 14 days.
- 04
Act
Personalized foods to close the exact gaps you have.
Step 02 · Aggregate
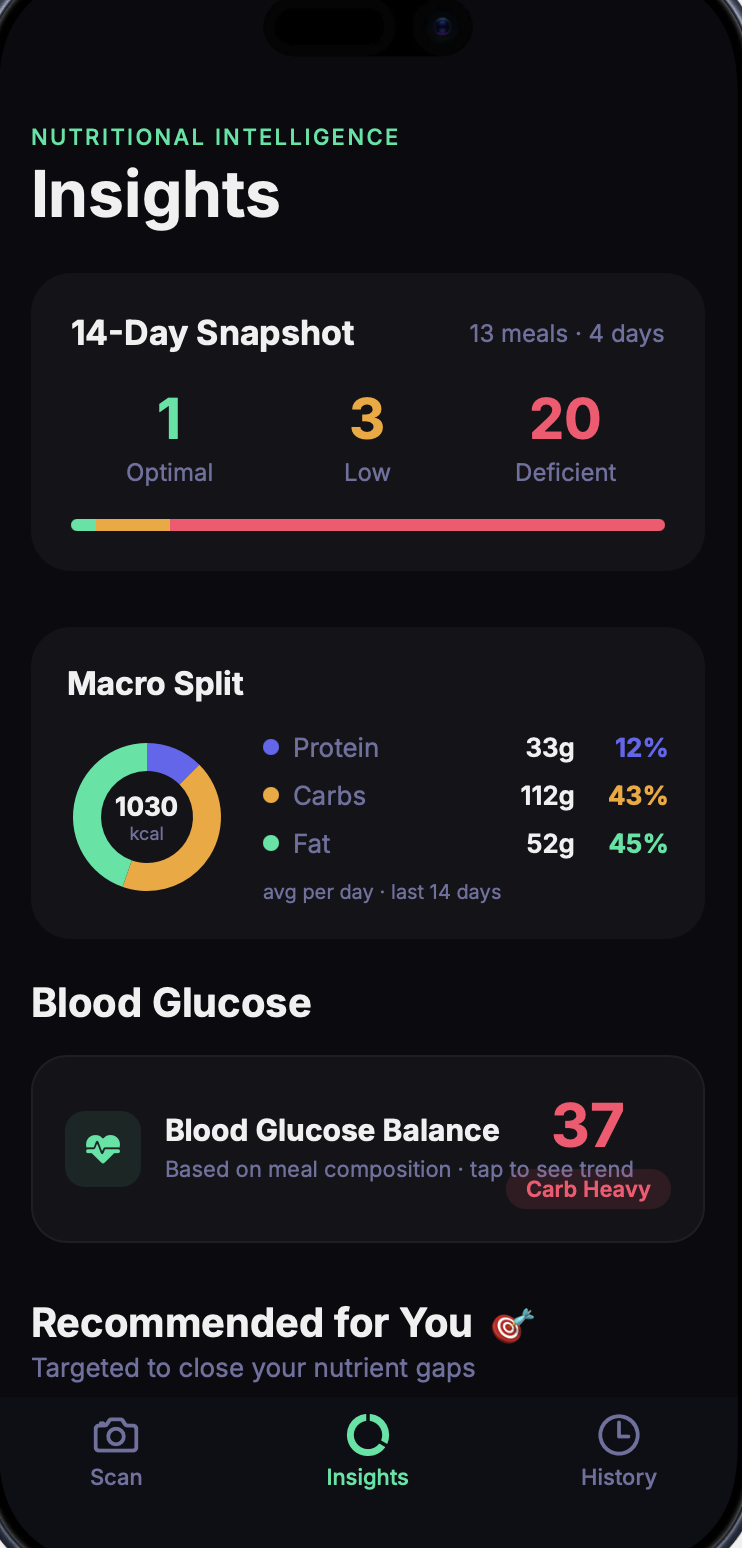
Calories & macros, balanced over 14 days.
A single meal can't tell the truth. VitaMenda averages your protein, carbs and fat across a 14-day horizon — the same window your body actually metabolizes nutrients on — so one indulgent dinner doesn't wreck the signal.
- Donut chart of average daily kcal split
- Protein / Carbs / Fat in grams and % of intake
- Built for athletes, biohackers and longevity protocols
Step 03 · Blood Sugar
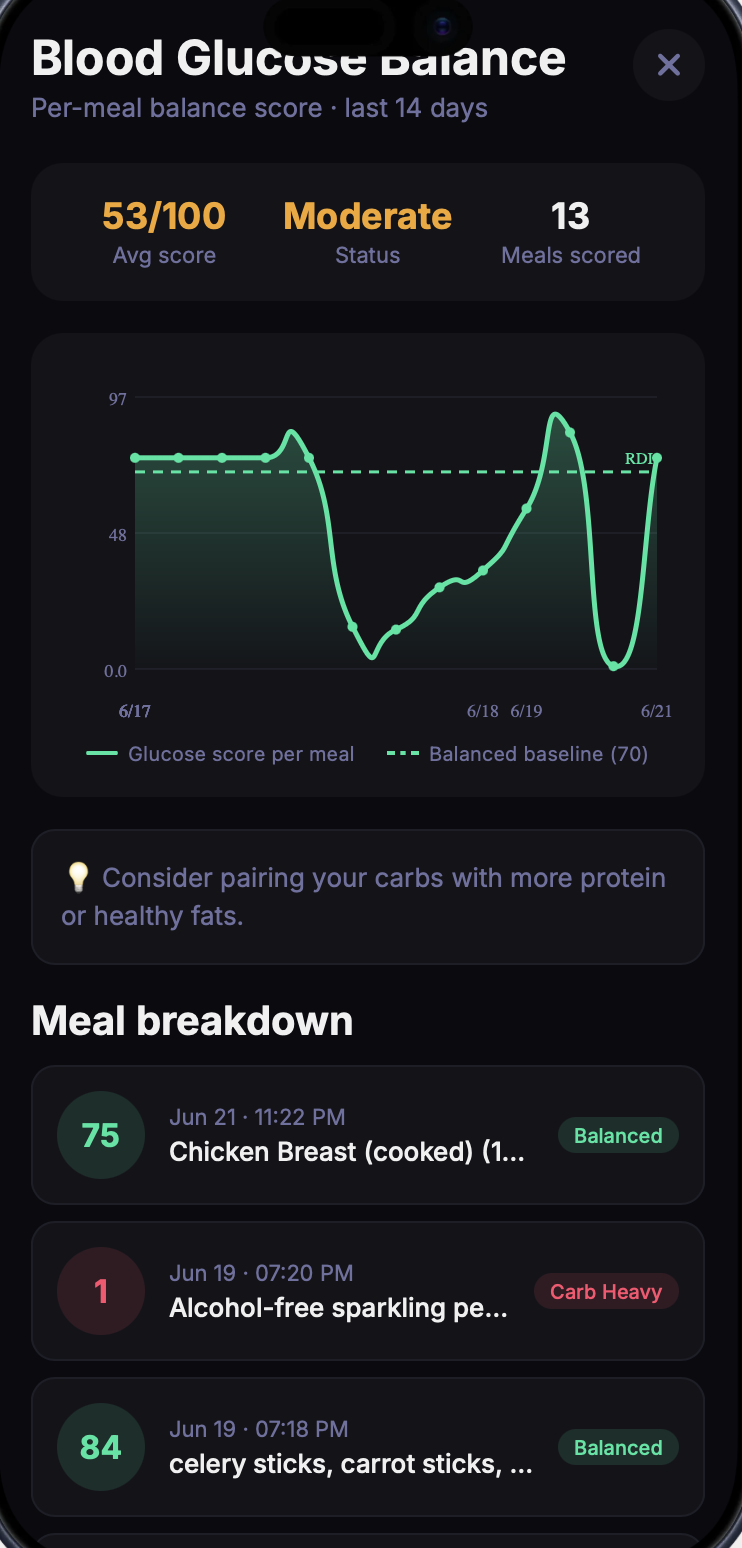
Glycemic balance, without a CGM.
Every meal is scored 0–100 on how steadily it releases energy — protein and fat dampen carbs, fiber slows absorption. See the trend line that explains your afternoon crashes.
- Per-meal glucose-balance score (0–100)
- Trend chart over the last 14 days
- Flags carb-heavy meals before they become a habit
Step 04 · Micronutrients
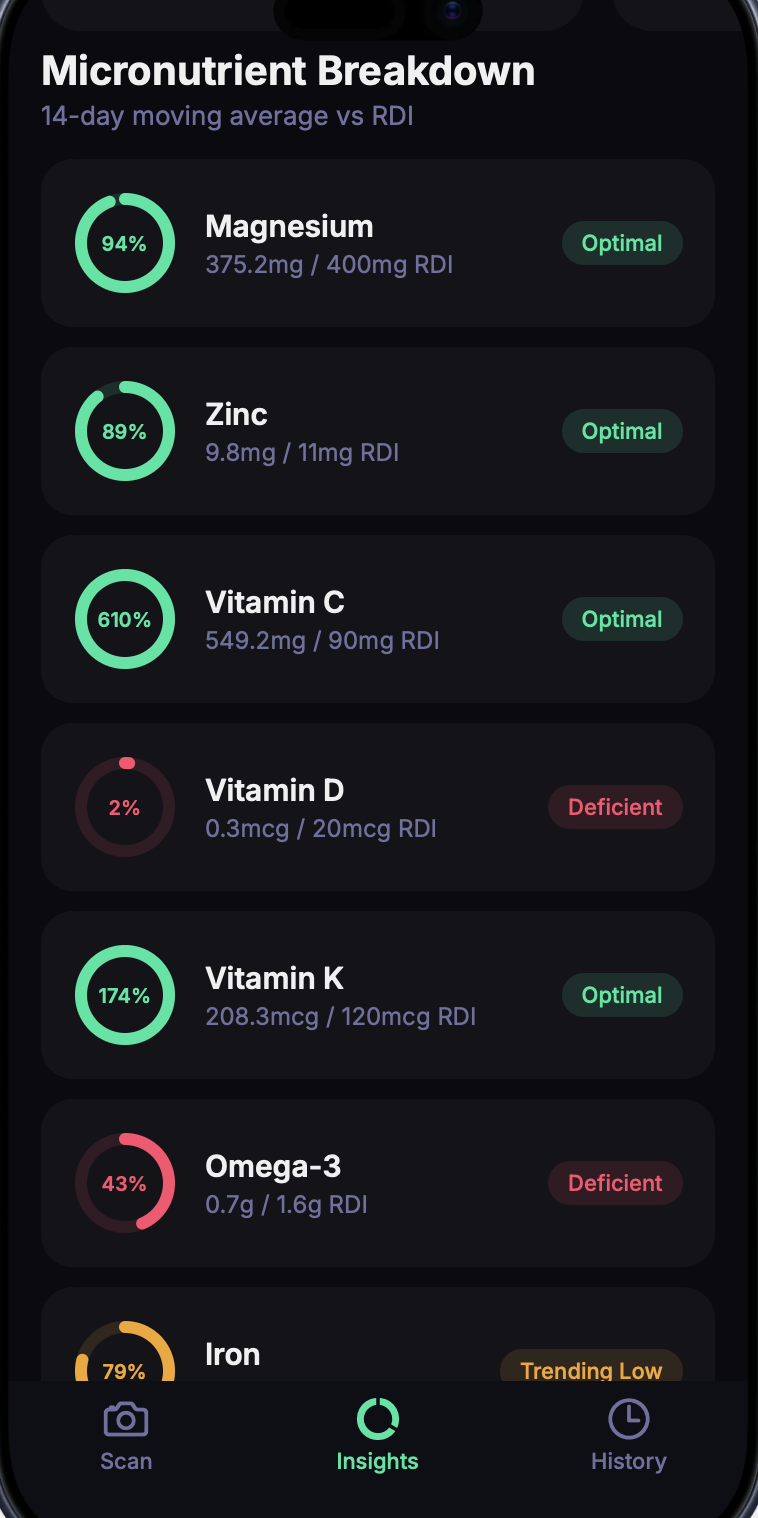
The vitamins and minerals you're actually missing.
25+ micronutrients tracked daily against your RDI. See your full panel at a glance — color-coded by status — and tap any nutrient to drill in.
- Magnesium, Zinc, Iron, Vitamin D, B12 and 20+ more
- Color-coded Deficient / Low / Optimal status
- Full panel view of every nutrient in one place
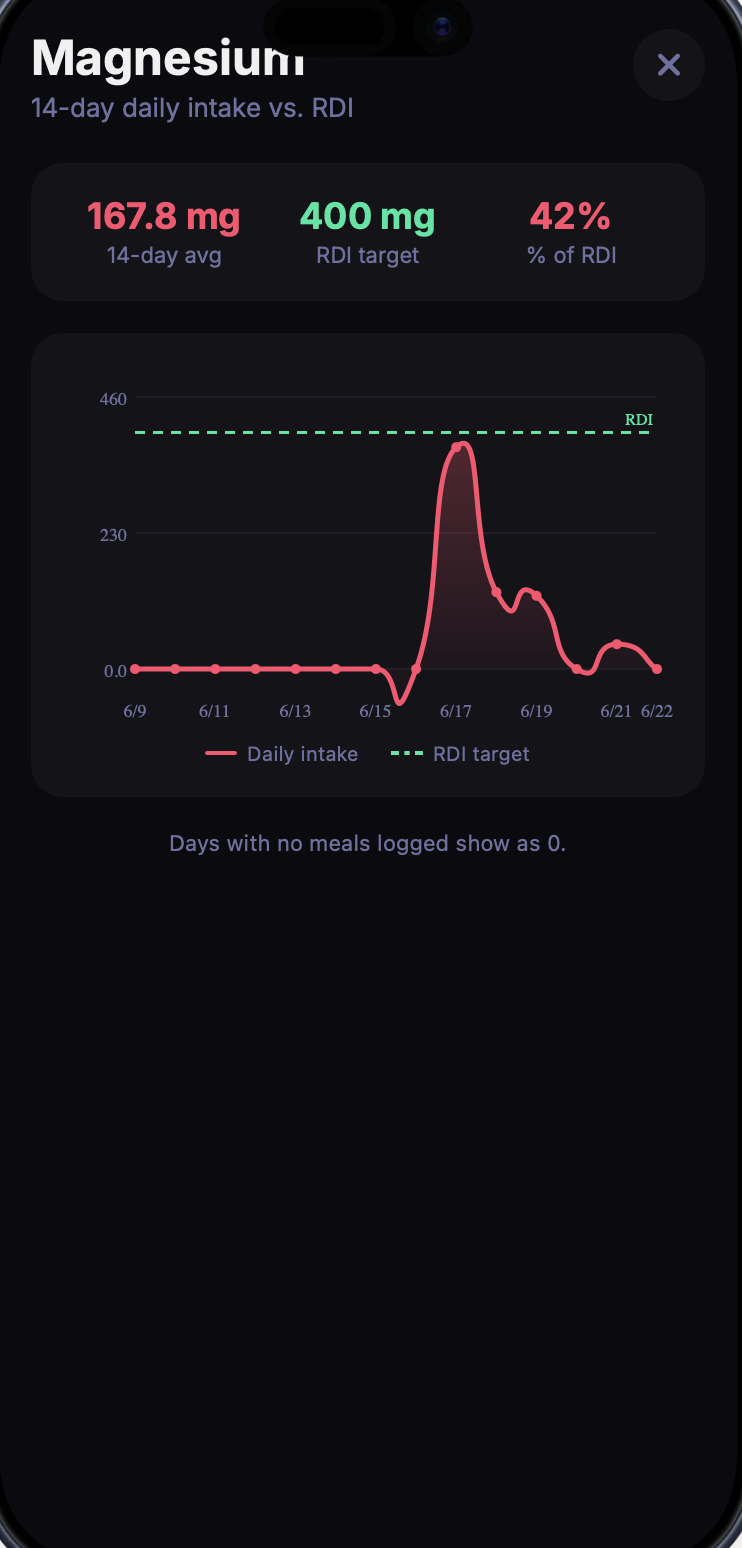
Step 05 · Breakdown
Micronutrient breakdown, day by day.
Tap any nutrient to open its detail view. See exactly how much you took in each day across the 14-day window, plotted against your RDI — so deficiencies become obvious, not hidden in averages.
- Per-nutrient 14-day intake chart vs RDI
- Spot the days you missed your target
- Understand why an average can lie — see the spread
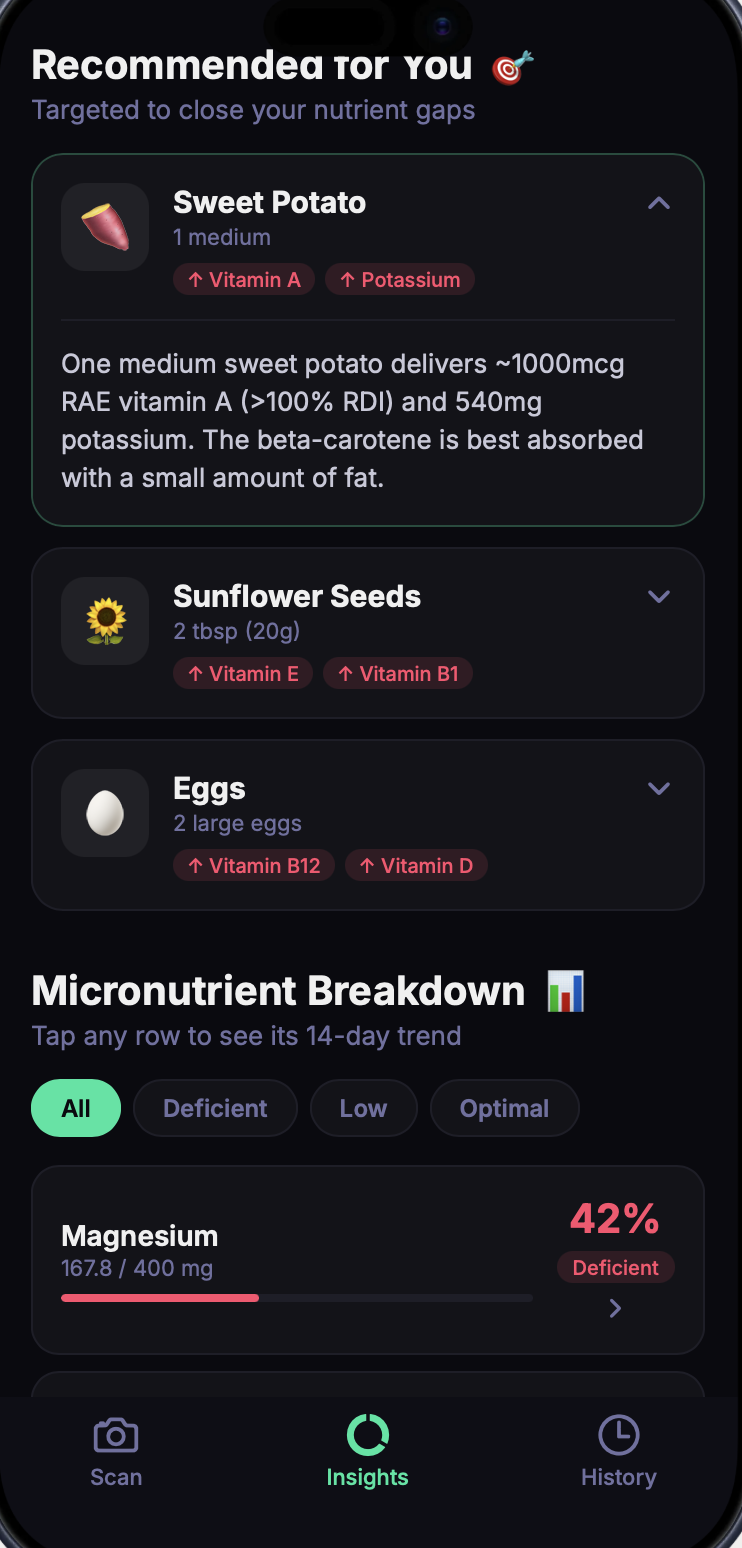
Step 06 · Act
Personalized food recommendations.
Not vague advice. VitaMenda looks at your actual nutrient gaps and recommends specific raw ingredients — with portion sizes and the science of why.
- Real foods, not supplements first
- Tagged by which nutrients they close
- Explains absorption — beta-carotene needs fat, etc.
FAQ
Common questions.
- How does VitaMenda calculate my nutrients from a photo?
- Our vision model identifies ingredients and portion sizes, then maps them to a verified food-composition database to compute calories, macros (protein, carbs, fat) and 25+ micronutrients per meal.
- What is the 14-day micronutrient horizon?
- Instead of judging a single day, VitaMenda aggregates intake on a rolling 14-day window — the timeframe most aligned with how vitamins and minerals actually accumulate in your body.
- Does VitaMenda track blood sugar?
- Yes. Each meal is scored on its glycemic balance (protein/fat/fiber vs refined carbs) to estimate blood-sugar impact without needing a CGM.
- Is there a free version?
- VitaMenda is launching with a generous free tier — no account required to start scanning meals.
Be first to debug your biology.
VitaMenda is launching on iOS. Join the waitlist — early members get lifetime founder pricing.